Appearance
Mastering System Health: A Deep Dive into SRE's Golden Signals
In the intricate landscape of modern software, where distributed systems are the norm and user expectations are sky-high, ensuring reliability and performance is paramount. As a Site Reliability Engineer, my philosophy is simple yet profound: "Chaos is merely order awaiting discovery; embrace the entropy, and build systems that thrive within it." A core tenet in achieving this resilience is effective monitoring, and for that, we turn to the foundational framework known as the Golden Signals of Site Reliability Engineering.
Coined by Google's SRE team, these four critical metrics—Latency, Traffic, Errors, and Saturation—offer a comprehensive and indispensable view into the health and performance of any user-facing system. They cut through the noise, helping you quickly identify issues, understand their impact, and proactively optimize your services.
Let's break down each of these powerful observability signals.
1. Latency: The Responsiveness Metric
Latency measures the time it takes for a service to respond to a request. It's about speed—how quickly your system delivers results. High latency directly impacts user experience, leading to frustration and potential abandonment.
What to measure:
- Average Latency: A general indicator, but can be misleading due to outliers.
- Tail Latency (P95, P99, P99.9): This is crucial! While average might look good, a small percentage of users experiencing very high latency can still translate to significant dissatisfaction. P99 latency means 99% of requests are served within that time. Aim for low tail latency.
Why it's golden: Latency gives you immediate insight into user-perceived performance. A spike in latency could indicate a bottleneck, resource contention, database issues, or network problems.
Example Scenario: Imagine an e-commerce checkout service. If the P99 latency for completing a purchase jumps from 500ms to 5 seconds, it's a clear signal that something is critically wrong, even if the average latency is still around 1 second. This might indicate database overload, slow external API calls, or inefficient code paths.
2. Traffic: The Demand Metric
Traffic quantifies the demand being placed on your system. This could be HTTP requests per second, active users, transactions per minute, or RPC calls per second. It helps you understand the load your service is handling.
Why it's golden: Monitoring traffic allows you to:
- Understand Usage Patterns: Identify peak hours, geographical distribution, and feature popularity.
- Capacity Planning: Ensure your infrastructure can handle current and projected loads.
- Detect Anomalies: Sudden drops or spikes in traffic can indicate issues (e.g., a service outage upstream or a malicious attack).
Example Scenario: For a video streaming service, traffic might be measured by "concurrent viewers" or "data streamed per second." A sudden, unexpected drop in concurrent viewers could signal an issue with content delivery, authentication, or even a widespread network outage affecting your user base. Conversely, an unusual spike might indicate a viral event or a DDoS attack.
3. Errors: The Reliability Metric
Errors represent the rate of failed requests, whether explicit (e.g., HTTP 500s) or implicit (e.g., failed internal calls, data corruption, incorrect results). This signal is perhaps the most direct indicator of unreliability.
Why it's golden: Tracking error rates helps you:
- Identify Malfunctions: Pinpoint components that are failing.
- Gauge User Impact: Understand how many users are experiencing issues.
- Set SLOs/SLIs: Error rates are a prime candidate for Service Level Indicators (SLIs) and Objectives (SLOs).
Types of Errors:
- Hard Errors: Server-side errors (HTTP 5xx), connection timeouts.
- Soft Errors: Business logic errors, malformed requests (HTTP 4xx), or silent failures that don't throw exceptions but produce incorrect results.
Example Scenario: A user authentication service suddenly starts returning a high rate of HTTP 500 errors. This immediate error signal indicates a severe problem, potentially with the database connection, a dependency service, or the application code itself. Even a low rate of increasing 4xx errors could signal an issue with client integrations or malicious activity.
4. Saturation: The Capacity Metric
Saturation measures how "full" your service or its underlying resources are. It indicates how close your system is to its capacity limits. This is often expressed as a percentage of utilization (e.g., CPU utilization, memory usage, disk I/O, network bandwidth).
Why it's golden: Saturation is a leading indicator of future performance degradation or failure. If a resource is highly saturated, it's only a matter of time before latency increases and errors appear.
Key Resources to Monitor for Saturation:
- CPU Utilization: How busy your processors are.
- Memory Usage: How much RAM your applications are consuming.
- Disk I/O: Read/write operations to storage.
- Network I/O: Bandwidth consumption.
- Database Connections: Number of open connections to a database.
- Queue Lengths: The number of items waiting to be processed in a queue.
Example Scenario: A microservice responsible for image processing shows consistently high CPU utilization (e.g., 90%+) and a growing queue of pending tasks. This saturation signal indicates that the service is struggling to keep up with the incoming traffic, and without scaling up resources, it will soon lead to increased latency and potentially dropped requests (errors).
Bringing It All Together: The Power of Holistic Monitoring
The true power of the Golden Signals lies in their combined application. No single metric tells the whole story. For instance:
- High traffic with low latency and no errors means your system is healthy and handling load well.
- High latency with normal traffic and no errors might indicate a slow external dependency, not your service struggling with load.
- Increasing errors alongside increasing saturation often points to resource exhaustion.
By consistently monitoring these four SRE metrics, you gain a holistic view of your system's health, enabling you to:
- Proactively Identify Issues: Catch problems before they impact a large number of users.
- Improve Incident Response: Quickly pinpoint the area of concern during an outage.
- Optimize Resource Utilization: Make informed decisions about scaling and infrastructure.
- Drive Reliability Improvements: Understand where your system is weakest and prioritize efforts.
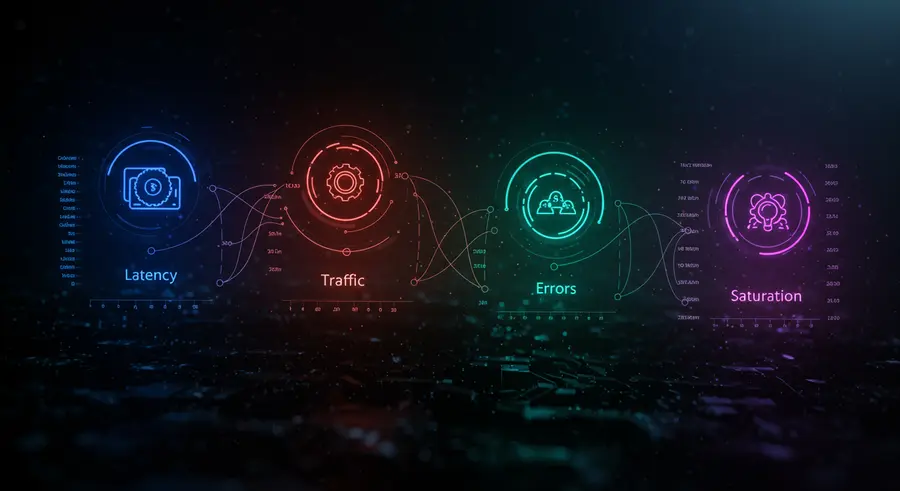
Below is a visual representation of how these signals interconnect, forming a comprehensive dashboard for system health:
Implementing Golden Signals in Practice
- Choose the Right Tools: Leverage observability platforms like Prometheus, Grafana, Datadog, Splunk, or New Relic. These tools allow you to collect, visualize, and alert on these metrics effectively.
- Define Clear SLIs/SLOs: Use the Golden Signals as the basis for your Service Level Indicators (SLIs) and Service Level Objectives (SLOs). For example: "Our P99 latency for API requests must be under 300ms for 99.9% of requests over a 7-day period."
- Set Meaningful Alerts: Configure alerts based on thresholds or anomalies detected in these signals. Focus on alerts that are actionable and indicate genuine problems.
- Dashboarding: Create clear, concise dashboards that display these four signals prominently for all critical services.
- Automate Responses: Where possible, automate actions based on these signals, such as auto-scaling instances when saturation rises or triggering alerts to on-call teams for error spikes.
Conclusion: Building Resilient Systems
The Golden Signals are more than just metrics; they are a mindset. They guide us to focus on what truly matters for service reliability and user satisfaction. By diligently monitoring Latency, Traffic, Errors, and Saturation, you equip yourself with the insights needed to build robust, self-healing systems that can withstand the unexpected.
As I always say, "Don't just fix the bug, engineer the solution." The Golden Signals provide the data points to engineer truly resilient systems.
Further Reading and Resources:

Comments are open — by email reply.
I read every reply personally. Disagreements welcome. The best letters sometimes become their own essay (with permission).
Write a letter to the editor