Appearance
Beyond the Dashboard: Unpacking the Power of Observability in Modern Systems
In the rapidly evolving landscape of cloud-native architectures, microservices, and continuous deployment, understanding the health and behavior of your systems has become more critical than ever. While monitoring has been a long-standing practice, a new paradigm, observability, has emerged to provide deeper, more actionable insights. Often, these terms are used interchangeably, but they represent distinct, albeit complementary, approaches to system understanding.
Let's unravel the nuances and explore why both are indispensable for building resilient and reliable software.
Monitoring: Your System's Early Warning System (The "What")
Monitoring is akin to a car's dashboard. It provides predefined metrics and alerts you when something is outside its normal operating parameters. You set up checks for known unknowns—things you anticipate might go wrong and for which you have established thresholds.
Key characteristics of monitoring:
- Focus on Knowns: You monitor what you expect to be important (CPU usage, memory, network I/O, error rates, latency of specific endpoints).
- Predefined Metrics: Data points are collected and aggregated based on pre-configured metrics and logs.
- Alerting: Triggers alerts when thresholds are breached (e.g., "CPU usage is above 80%").
- Reactive: Primarily tells you that something is wrong.
Common Monitoring Tools & Practices:
- Prometheus: For collecting and alerting on time-series data.
- Nagios: Traditional infrastructure monitoring.
- Zabbix: Enterprise-grade open-source monitoring.
- Dashboards: Tools like Grafana visualize pre-defined metrics.
Example Scenario: Imagine you have a web application. A typical monitoring setup would track:
- HTTP request latency
- Error rates (e.g., 5xx errors)
- Database connection pool usage
- Server CPU and memory utilization
If your monitoring dashboard shows a sudden spike in 5xx errors, it tells you, "Something is wrong with the application serving requests." But it doesn't immediately tell you why or how it's happening. This is where observability steps in.
Observability: The Detective Toolkit (The "Why" and "How")
If monitoring tells you that something is wrong, observability helps you figure out why it's happening and how to fix it. It's about designing your systems so that their internal state can be inferred from their external outputs. This property is built into the system itself, allowing you to ask novel, unanticipated questions without deploying new code or adding custom instrumentation.
Key characteristics of observability:
- Focus on Unknowns: Enables debugging and understanding of unforeseen issues.
- Inference from Outputs: Relies on collecting high-fidelity data—metrics, logs, and traces—to reconstruct the system's behavior.
- Proactive Debugging: Allows you to explore and investigate complex system interactions.
- Context-Rich: Provides a holistic view, connecting disparate pieces of information.
The Three Pillars of Observability: For a system to be truly observable, it needs to emit telemetry data across three distinct categories:
1. Metrics 📊
Metrics are numerical measurements collected over time. While monitoring often uses metrics, in an observability context, they are often high-cardinality, meaning they contain rich dimensions (tags, labels) that allow for granular filtering and aggregation.
Examples:
- Number of requests per service endpoint.
- Latency broken down by customer ID or region.
- Queue depths, container restarts.
2. Logs 📜
Logs are discrete, timestamped events that describe what happened at a specific point in time within an application or system component. For observability, logs need to be structured (e.g., JSON) and include correlation IDs to link them across services.
Examples:
- User login attempts.
- Database query execution.
- Error messages with stack traces.
3. Traces 🔗
Traces represent the end-to-end journey of a single request or transaction as it propagates through a distributed system. Each hop (span) in the trace provides context, latency, and success/failure status, allowing you to pinpoint bottlenecks or errors across multiple services.
Examples:
- A user's click on a "Buy Now" button leading to microservices calls for order processing, inventory check, and payment gateway.
- A single API request traversing an API Gateway, a user service, a product catalog service, and a database.
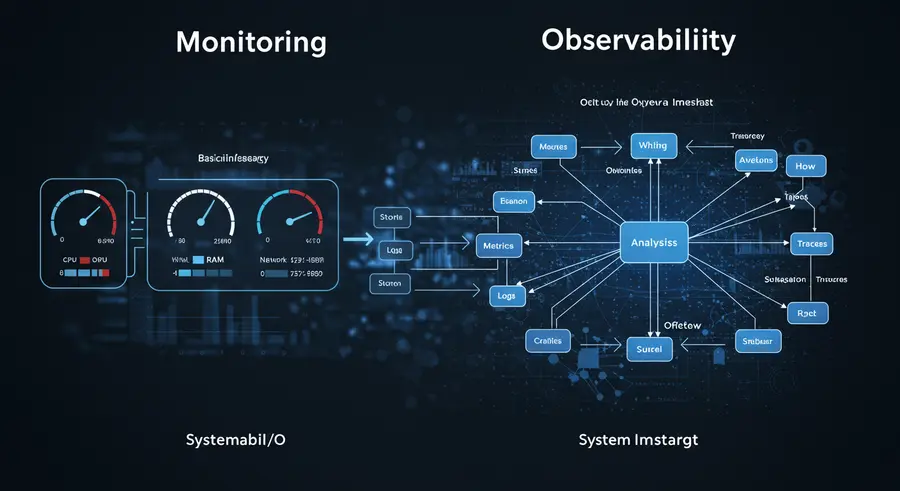
Monitoring vs. Observability: A Visual Analogy
Consider a light bulb:
- Monitoring: You look at the light switch. If it's off, you know the light isn't working. If it's on, you know it is. This is a basic "is it working?" check.
- Observability: You can analyze the electrical current flowing to the bulb, the filament's resistance, the type of gas inside the bulb, and its temperature. This allows you to understand why it might be flickering, how efficient it is, or when it might fail, even if it's currently on.
Here’s a visual representation:
Why Observability Matters in Modern IT
The shift towards microservices, serverless, and cloud-native architectures has made traditional monitoring insufficient. Systems are now highly distributed, dynamic, and complex. Issues often arise from unforeseen interactions between components rather than a single failing part.
Observability provides:
- Faster Root Cause Analysis: By correlating metrics, logs, and traces, engineers can quickly pinpoint the exact cause of an issue, reducing Mean Time To Resolution (MTTR).
- Proactive Problem Detection: Understanding system behavior allows for identifying subtle degradation before it escalates into an outage.
- Improved Collaboration: A shared understanding of system state across development, operations, and SRE teams.
- Enhanced Innovation: Confidence to deploy new features knowing you can understand and debug their impact quickly.
Practical Examples & Tooling
To achieve observability, you need tools that can ingest, process, and analyze the three pillars of telemetry data.
Sample Code for Emitting Telemetry (Python example with OpenTelemetry):
Imagine a simple user service and a product service.
python
# user_service.py (simplified)
from opentelemetry import trace
from opentelemetry.sdk.trace import TracerProvider
from opentelemetry.sdk.trace.export import ConsoleSpanExporter, SimpleSpanProcessor
from opentel_metry.exporter.otlp.proto.grpc.trace_exporter import OTLPSpanExporter
import logging

# Configure tracer (for real world, use OTLPSpanExporter to send to collector)
provider = TracerProvider()
processor = SimpleSpanProcessor(ConsoleSpanExporter()) # For demonstration
# processor = SimpleSpanProcessor(OTLPSpanExporter(endpoint="localhost:4317")) # For actual OTLP endpoint
provider.add_span_processor(processor)
trace.set_tracer_provider(provider)

tracer = trace.get_tracer(__name__)
logger = logging.getLogger(__name__)
logger.setLevel(logging.INFO)
logging.basicConfig() # Simple console logger

def get_user_profile(user_id):
    with tracer.start_as_current_span("get_user_profile"):
        logger.info(f"Fetching profile for user_id: {user_id}")
        # Simulate some work
        if user_id == "error_user":
            logger.error(f"Failed to fetch profile for {user_id}")
            raise ValueError("User not found")
        return {"id": user_id, "name": f"User {user_id}", "email": f"user{user_id}@example.com"}

if __name__ == "__main__":
    try:
        profile = get_user_profile("123")
        print(f"Profile: {profile}")
        profile = get_user_profile("error_user") # This will raise an error and log it
    except ValueError as e:
        print(f"Error: {e}")

# In a real scenario, you'd also emit metrics here, e.g., using Prometheus client libraries:
# from prometheus_client import Counter, Gauge
# REQUEST_COUNT = Counter('requests_total', 'Total request count', ['endpoint'])
# REQUEST_LATENCY = Gauge('request_latency_seconds', 'Request latency', ['endpoint'])
# REQUEST_COUNT.labels('/user_profile').inc()
This simple example shows how OpenTelemetry can emit traces (via start_as_current_span) and how logs are generated. A real application would integrate metric collection as well. These telemetry signals are then sent to observability platforms for aggregation and analysis.
Leading Observability Platforms:
- New Relic: Offers a full-stack observability platform with APM, infrastructure monitoring, logs, and distributed tracing.
- Datadog: Combines infrastructure monitoring, APM, log management, and security monitoring.
- Dynatrace: Provides AI-powered full-stack observability with automated root-cause analysis.
- Grafana Labs (Loki, Tempo, Prometheus): An open-source stack for logs, traces, and metrics, respectively.
- Honeycomb: Specializes in high-cardinality data for debugging production systems.
Conclusion: A Symbiotic Relationship
Monitoring and observability are not mutually exclusive; they are a symbiotic pair. Monitoring provides the "known knowns," acting as your first line of defense and alerting you to predefined problems. Observability provides the "known unknowns" and even "unknown unknowns," empowering you to debug and understand complex behaviors when things go wrong in ways you didn't anticipate.
By investing in both, and especially by designing systems with observability in mind from the outset (instrumenting them to emit rich telemetry), organizations can achieve unprecedented levels of system understanding, resilience, and operational excellence. Embrace the entropy, instrument the unknown, and build systems that thrive within the chaos.
References & Further Reading:
- New Relic: Observability vs. monitoring - what's the difference?
- Medium (Cindy Sridharan): Monitoring and Observability
- Elastic: 3 reasons why monitoring is different from observability
- Uptimerobot: Observability vs. Monitoring: Key Differences, Use Cases & More
- Middleware.io: Top 10 Observability Trends for 2025

Comments are open — by email reply.
I read every reply personally. Disagreements welcome. The best letters sometimes become their own essay (with permission).
Write a letter to the editor